

LayerZero Power Systems is a leading provider of power quality monitoring solutions for data centers. Our products provide real-time monitoring and management of power distribution systems, helping to ensure maximum uptime and operational efficiency.
Our products feature accurate measurements of voltage, current, frequency, real power, reactive and apparent power, power factor, and more. We also offer standard waveform capture functionality, which enables voltage and current waveforms to be viewed at the PDU inputs and outputs, RPP inputs, and each of the branch circuit breaker outputs. This allows for a comprehensive view of the entire power flow and enables data center facilities to instantly capture a real-time fingerprint of the power flow.
By utilizing LayerZero equipment, data center facilities have the capability to quickly analyze potential power quality issues and determine the root cause of events. Our products are synchronized with the NTP clock, so they provide a macro view of the entire power flow, with waveform captures that are time-stamped to all events. This provides valuable insights into power quality issues that can help data center managers make informed decisions about power management and optimization.
At the server level, waveform captures are available for each branch circuit breaker, providing a detailed view of the power flow and enabling targeted analysis of potential issues. This allows for precise troubleshooting and resolution of issues, minimizing downtime and ensuring maximum uptime for critical applications.
LayerZero Power Systems is a trusted provider of power quality monitoring solutions. Our products are designed with reliability and flexibility in mind, providing data center facilities with a stable and well-developed foundation for their power distribution systems.
To learn more about LayerZero Power Quality Monitoring, please contact us today. We would be happy to answer any questions you have and help you find the right solution for your needs.
You may be interested in reading our white paper, ITIC Curve Tech Brief.
VDAT Plotting Examples - ITIC Plots

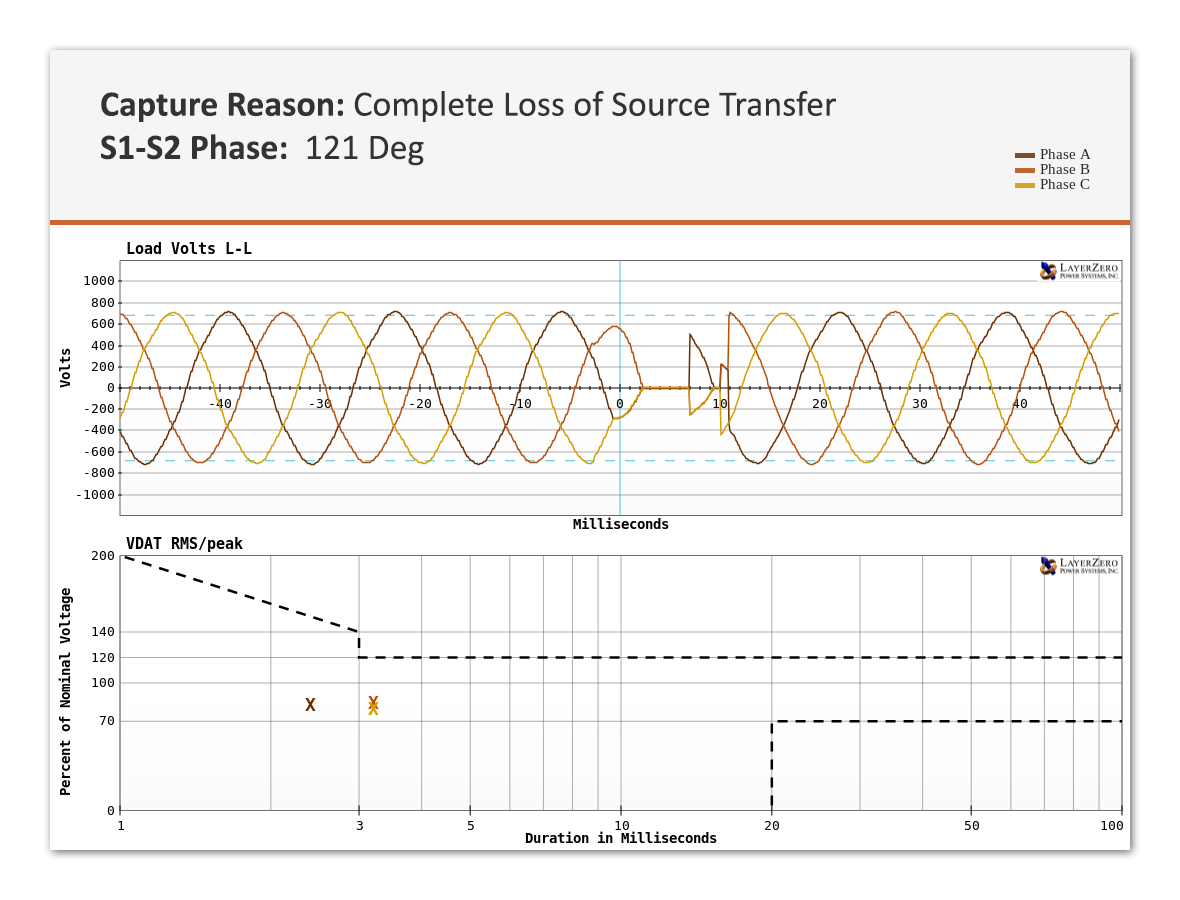
This event shows a "Complete Loss of Source Transfer". The event indicates that voltage has fallen below the acceptable threshold. This event is within the boundaries of the ITIC curve, so it is not considered to be a critical event.
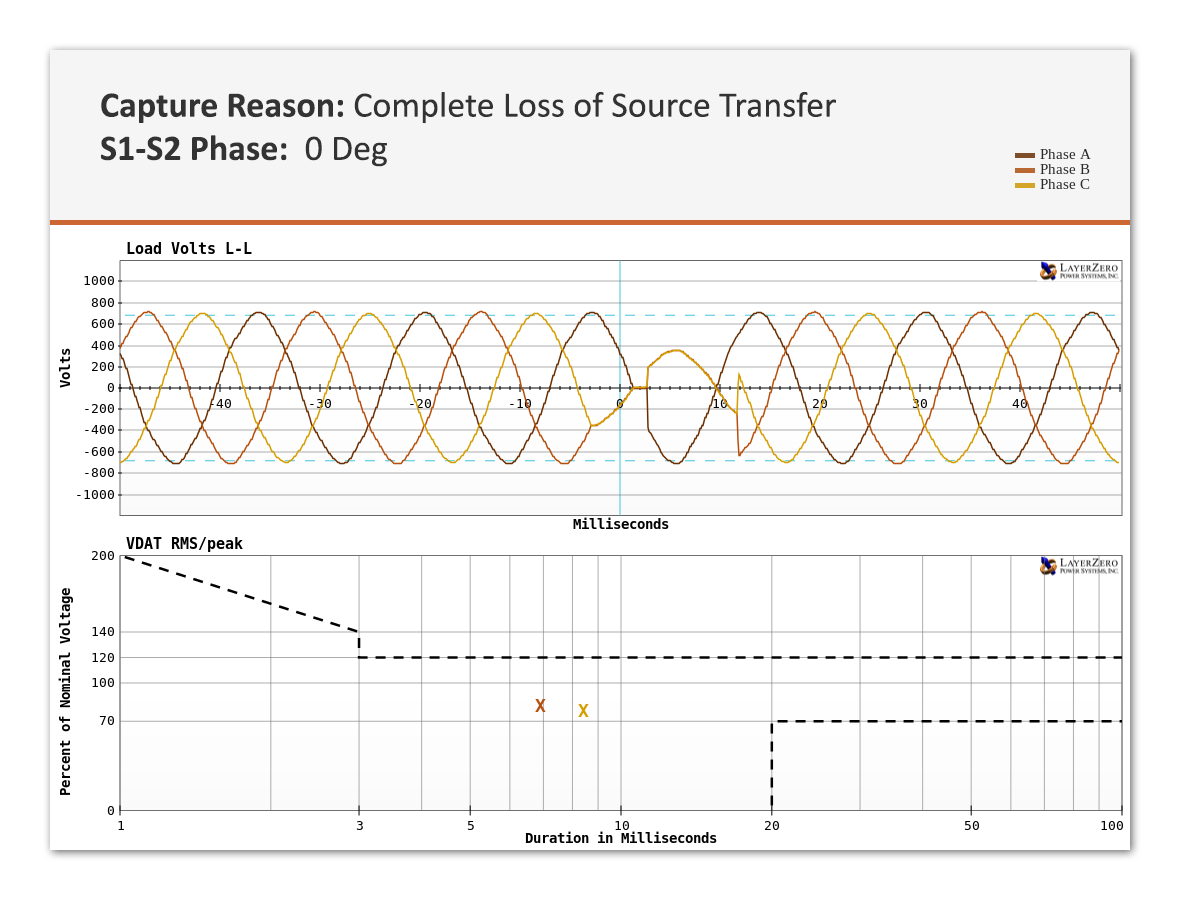
This waveform capture shows a "Under Voltage Source Transfer" with a delayed transfer utilizing our "Dynamic Phase Compensation" algorithm. There is zero saturation in the transformers downstream of the STS. The event indicates that a voltage deviation that falls below the acceptable threshold on source 2. The event is within the boundaries of the ITIC curve.
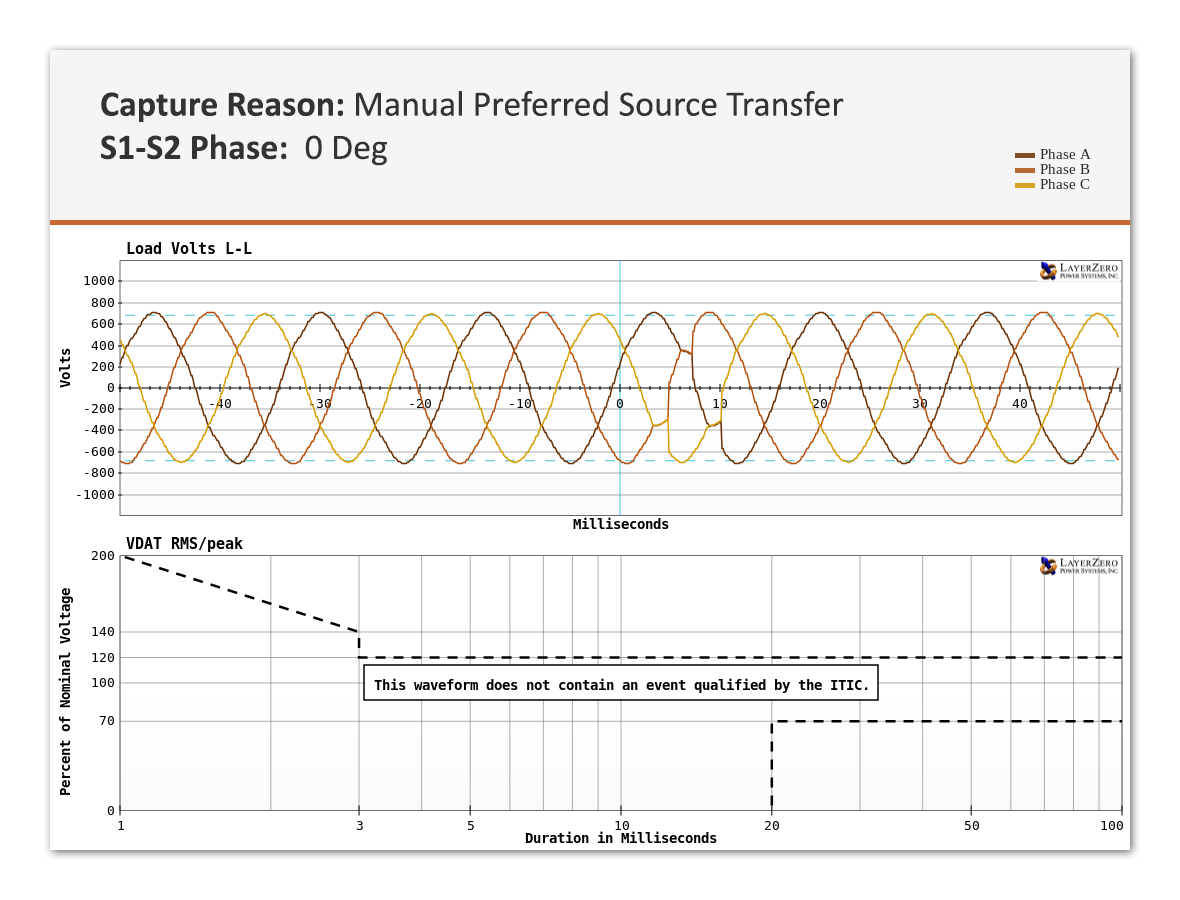
The waveform capture shows a graphical representation of the quality of the power during a "Manual Preferred Source Transfer". The transfer event did not qualify for an ITIC plot, and the text overlay over the ITIC plot indicates that one was not generated.
The power quality falls within the boundaries of the ITIC curve, so it will not cause damage to critical equipment.