LayerZero focuses on engineering driven, mission critical power distribution where reliability,
safety, and operational visibility are prioritized. The difference is not a single feature,
but the combination of architecture, performance, and monitoring that supports uptime.
Key takeaways
Mission critical focus with uptime as the primary design objective.
Engineering centered approach to power architecture and customization.
Monitoring and diagnostics designed for operational decision making.
Manufacturing and operations in Northeast Ohio with close quality control.
Full explanation
Many power products move electricity from point A to point B. In mission critical environments,
the more difficult challenge is designing power distribution that remains resilient under real
world conditions, is maintainable over time, and provides visibility to operators who must
prevent outages rather than react to them.
LayerZero designs systems around reliability and safety first, with configurations tailored to
facility architecture, redundancy requirements, and operational standards. This approach aligns
distribution equipment, protection strategy, and monitoring to reduce risk and simplify service
workflows.
Practical differences customers care about
Power continuity through designs that reduce outage exposure.
Maintainability supported by service friendly layouts and safe work practices.
Visibility through monitoring that validates normal operation and highlights anomalies.
Integration with data center and facility management environments.
Customization for unique electrical and physical constraints.
The most effective way to evaluate differences is to start with single points of failure,
maintenance strategy, and monitoring needs, then map equipment selection to those requirements.
LayerZero supports this process through applications guidance and product configuration.
An ITIC plot is a voltage-tolerance graph that shows whether a power disturbance stayed within the operating limits of typical information technology equipment. In practical terms, it provides a simple binary answer: the connected IT load remained within acceptable tolerance, or the event exceeded what the load is designed to withstand.
Key takeaways
Plots voltage magnitude as a percentage of nominal against event duration.
Shows whether a disturbance remained inside or outside the ITIC tolerance envelope.
Converts complex waveform data into a fast pass/fail style result.
Widely used to evaluate transfer events, voltage sags, swells, and other power quality disturbances.
What an ITIC plot shows
An ITIC plot, sometimes referred to as the ITIC Curve or CBEMA Curve, is a voltage-tolerance model developed to represent how typical information technology equipment responds to voltage disturbances over time.
The vertical axis shows voltage as a percentage of nominal. The horizontal axis shows event duration on a logarithmic time scale. If the RMS voltage remains within the ITIC boundaries, the connected load is generally considered to have remained operational. If the event falls outside those limits, the disturbance may have been severe enough to affect sensitive equipment.
Why ITIC plots are useful in mission-critical power systems
Waveform captures provide detailed phase-by-phase voltage and current data, but they usually require trained interpretation. An ITIC plot translates that same event into a much simpler visual result that operators, engineers, and facility teams can understand immediately.
That is why ITIC and VDAT plots are valuable in mission-critical environments: they show whether the disturbance remained within acceptable tolerance for connected IT equipment without requiring deep waveform analysis.
In other words, they answer the operational question first: was the load likely affected, or not?
How ITIC plots are used during static transfer events
In a static transfer switch, power quality analyzers continuously monitor both sources and the output. When a significant event occurs—such as a source transfer, undervoltage condition, or abnormal source disturbance—the system automatically generates both a waveform capture and an ITIC plot.
This is especially useful during source transfers because the waveform shows exactly what occurred electrically, while the ITIC plot shows whether the output disturbance stayed within the tolerance envelope seen by downstream IT equipment.
For facilities running critical digital infrastructure, that means the transfer event can be evaluated immediately at the load rather than only at the source.
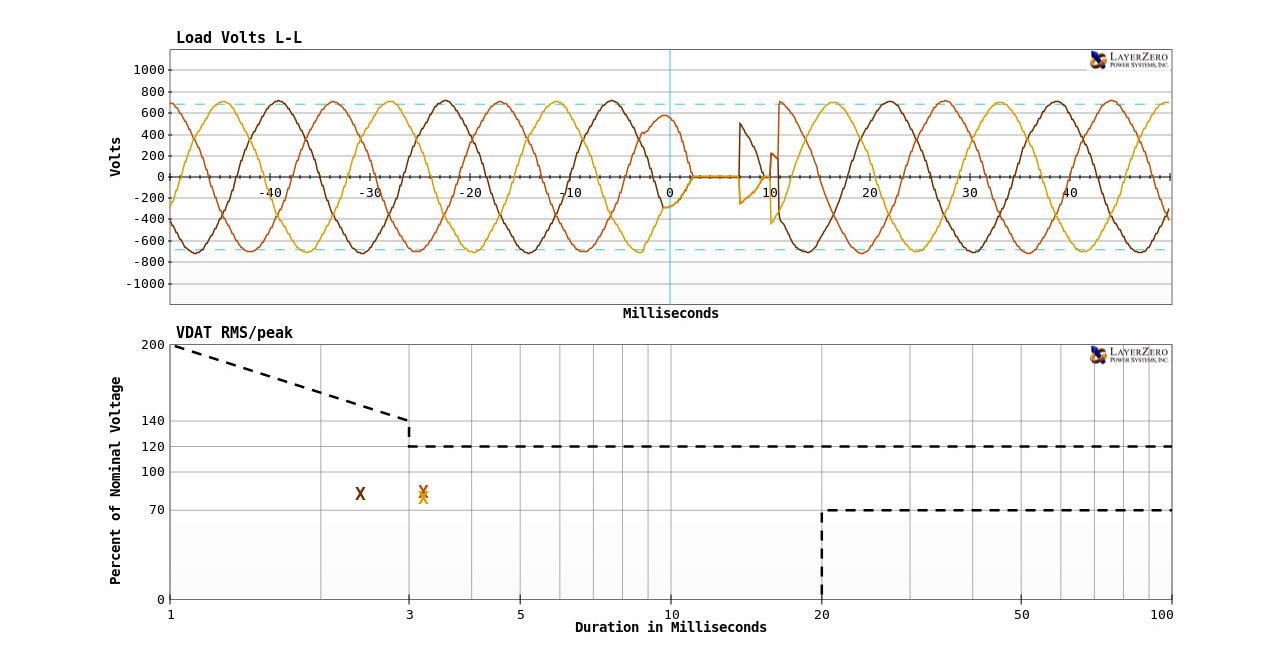
How to read the example image
The upper graph shows the actual voltage waveform during the event. The lower graph plots that event by voltage magnitude and duration against the ITIC tolerance envelope.
The upper chart is the waveform capture. It shows the actual electrical disturbance at the load, including the momentary voltage interruption during transfer.
The lower chart is the ITIC/VDAT plot. The marked event is placed against the ITIC tolerance curve using duration and voltage magnitude. Because the event remains inside the acceptable region, the plot indicates that connected IT equipment stayed within expected voltage tolerance.
This is why ITIC plots are often more useful operationally than waveform captures alone: the waveform explains the event, while the ITIC plot explains the likely impact.
ITIC plots and Dynamic Phase Compensation
One of the most valuable uses of ITIC plotting is verifying transfer quality when sources are out of phase.
LayerZero’s technical brief shows transfer events at 90°, 150°, and 180° out of phase, with waveform captures and ITIC plots generated automatically during each event. In each case, the plotted disturbance remained within ITIC boundaries even when transfer timing was intentionally delayed to control transformer inrush.
This is where Dynamic Phase Compensation becomes important. Rather than transferring blindly at the first available moment, the control logic waits for the optimal electrical point to minimize transformer saturation and maintain acceptable load conditions.
Where ITIC plots are most useful
ITIC plots are especially valuable anywhere power quality events must be documented clearly and interpreted quickly, including:
What monitoring options are available on LayerZero equipment?
Direct answer
LayerZero equipment offers comprehensive monitoring of voltage, current, power, power quality, alarms, and waveform data for mission-critical systems.
Key takeaways
Detailed voltage, current, and power monitoring.
Advanced power quality metrics.
Waveform capture and alarm reporting.
Supports STS, ePOD, and panel monitoring.
Full explanation
LayerZero provides extensive monitoring capabilities across its product portfolio to support reliability, safety, and operational awareness.
STS monitoring specifications include voltage, current, power, frequency, harmonic distortion, energy, demand, phase difference, crest factor, and K-factor measurements.
ePOD monitoring specifications include voltage, current, frequency, real and apparent power, reactive power, power factor, energy usage, demand, crest factor, and harmonic distortion.
LayerZero equipment also supports waveform capture and a wide range of alarms, including voltage, current, frequency, phase rotation, harmonic distortion, source availability, and output failure alarms.
These monitoring capabilities provide real-time insight into power system health and enable proactive maintenance and operational optimization.