

What is an ITIC plot?
Direct answer
An ITIC plot is a voltage-tolerance graph that shows whether a power disturbance stayed within the operating limits of typical information technology equipment. In practical terms, it provides a simple binary answer: the connected IT load remained within acceptable tolerance, or the event exceeded what the load is designed to withstand.
Key takeaways
- Plots voltage magnitude as a percentage of nominal against event duration.
- Shows whether a disturbance remained inside or outside the ITIC tolerance envelope.
- Converts complex waveform data into a fast pass/fail style result.
- Widely used to evaluate transfer events, voltage sags, swells, and other power quality disturbances.
What an ITIC plot shows
An ITIC plot, sometimes referred to as the ITIC Curve or CBEMA Curve, is a voltage-tolerance model developed to represent how typical information technology equipment responds to voltage disturbances over time.
The vertical axis shows voltage as a percentage of nominal. The horizontal axis shows event duration on a logarithmic time scale. If the RMS voltage remains within the ITIC boundaries, the connected load is generally considered to have remained operational. If the event falls outside those limits, the disturbance may have been severe enough to affect sensitive equipment.
Why ITIC plots are useful in mission-critical power systems
Waveform captures provide detailed phase-by-phase voltage and current data, but they usually require trained interpretation. An ITIC plot translates that same event into a much simpler visual result that operators, engineers, and facility teams can understand immediately.
That is why ITIC and VDAT plots are valuable in mission-critical environments: they show whether the disturbance remained within acceptable tolerance for connected IT equipment without requiring deep waveform analysis.
In other words, they answer the operational question first: was the load likely affected, or not?
How ITIC plots are used during static transfer events
In a static transfer switch, power quality analyzers continuously monitor both sources and the output. When a significant event occurs—such as a source transfer, undervoltage condition, or abnormal source disturbance—the system automatically generates both a waveform capture and an ITIC plot.
This is especially useful during source transfers because the waveform shows exactly what occurred electrically, while the ITIC plot shows whether the output disturbance stayed within the tolerance envelope seen by downstream IT equipment.
For facilities running critical digital infrastructure, that means the transfer event can be evaluated immediately at the load rather than only at the source.
How to read the example image
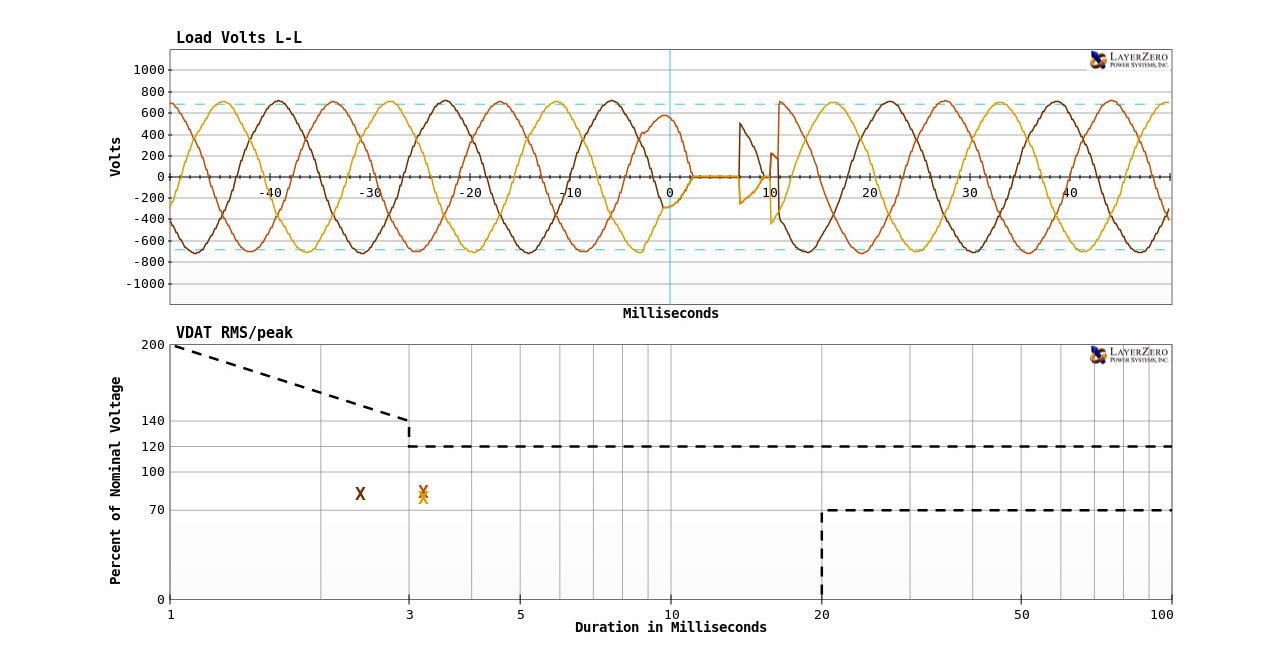
The upper chart is the waveform capture. It shows the actual electrical disturbance at the load, including the momentary voltage interruption during transfer.
The lower chart is the ITIC/VDAT plot. The marked event is placed against the ITIC tolerance curve using duration and voltage magnitude. Because the event remains inside the acceptable region, the plot indicates that connected IT equipment stayed within expected voltage tolerance.
This is why ITIC plots are often more useful operationally than waveform captures alone: the waveform explains the event, while the ITIC plot explains the likely impact.
ITIC plots and Dynamic Phase Compensation
One of the most valuable uses of ITIC plotting is verifying transfer quality when sources are out of phase.
LayerZero’s technical brief shows transfer events at 90°, 150°, and 180° out of phase, with waveform captures and ITIC plots generated automatically during each event. In each case, the plotted disturbance remained within ITIC boundaries even when transfer timing was intentionally delayed to control transformer inrush.
This is where Dynamic Phase Compensation becomes important. Rather than transferring blindly at the first available moment, the control logic waits for the optimal electrical point to minimize transformer saturation and maintain acceptable load conditions.
Where ITIC plots are most useful
ITIC plots are especially valuable anywhere power quality events must be documented clearly and interpreted quickly, including:
- Data centers
- AI and high-density compute environments
- Enterprise digital infrastructure
- Colocation facilities
- Financial systems with sensitive electronic loads
They are commonly used for transfer validation, alarm review, disturbance documentation, and post-event analysis where fast interpretation matters.
ITIC plot vs waveform capture
Waveform capture shows the electrical event in detail.
ITIC plot shows whether that event stayed inside or outside accepted IT load tolerance.
Used together, they provide both the technical explanation and the practical answer.
Last reviewed by LayerZero Power Systems.